
Orange County Housing Market vs. the U.S.: Why Local Trends Are Telling a Different Story

The latest national housing data shows a market that is slowing down. According to the most recent Homes.com National Housing Market Report, U.S. home sales were down 6% year over year in September 2026, inventory was up 1.9%, and the national median sale price increased only 0.6%.
That paints a picture of a softer market nationally.
But Orange County is showing a somewhat different pattern.
While local sales activity has slowed, Orange County is not following the national inventory trend. In fact, active listings are down year over year, and prices have held up better than the national figures might suggest.
The takeaway: real estate is local, and Orange County is behaving differently from the broader U.S. housing market.
National Market vs. Orange County at a Glance
For September 2026, the national and Orange County numbers look like this:
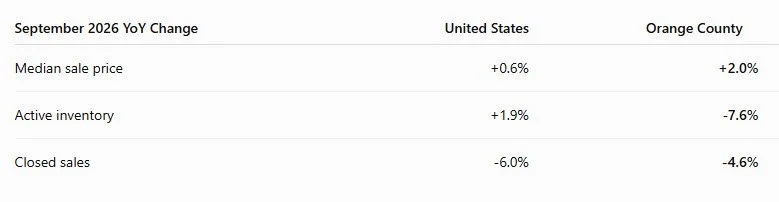
Orange County is clearly feeling the effects of a cooler market, but the local data suggests a market that is more supply-constrained and more price-resilient than the U.S. overall.
Inventory Is Falling in Orange County, Not Rising
One of the biggest differences between the national market and Orange County is inventory.
Nationally, Homes.com reported that the number of homes for sale increased 1.9% from a year earlier. Orange County, by contrast, moved in the opposite direction.
Orange County had 6,879 active residential listings in September 2026, compared with 7,446 in September 2025, a 7.6% year-over-year decline.
That matters because inventory is one of the main drivers of pricing pressure. When supply rises, buyers usually gain more leverage. When supply tightens, prices tend to find support.
Even with this decline, inventory is still well above the very tight levels seen in 2023, so this is not a return to the frenzy of prior years. But it does suggest that Orange County is not seeing the same supply build that is showing up in many other parts of the country.
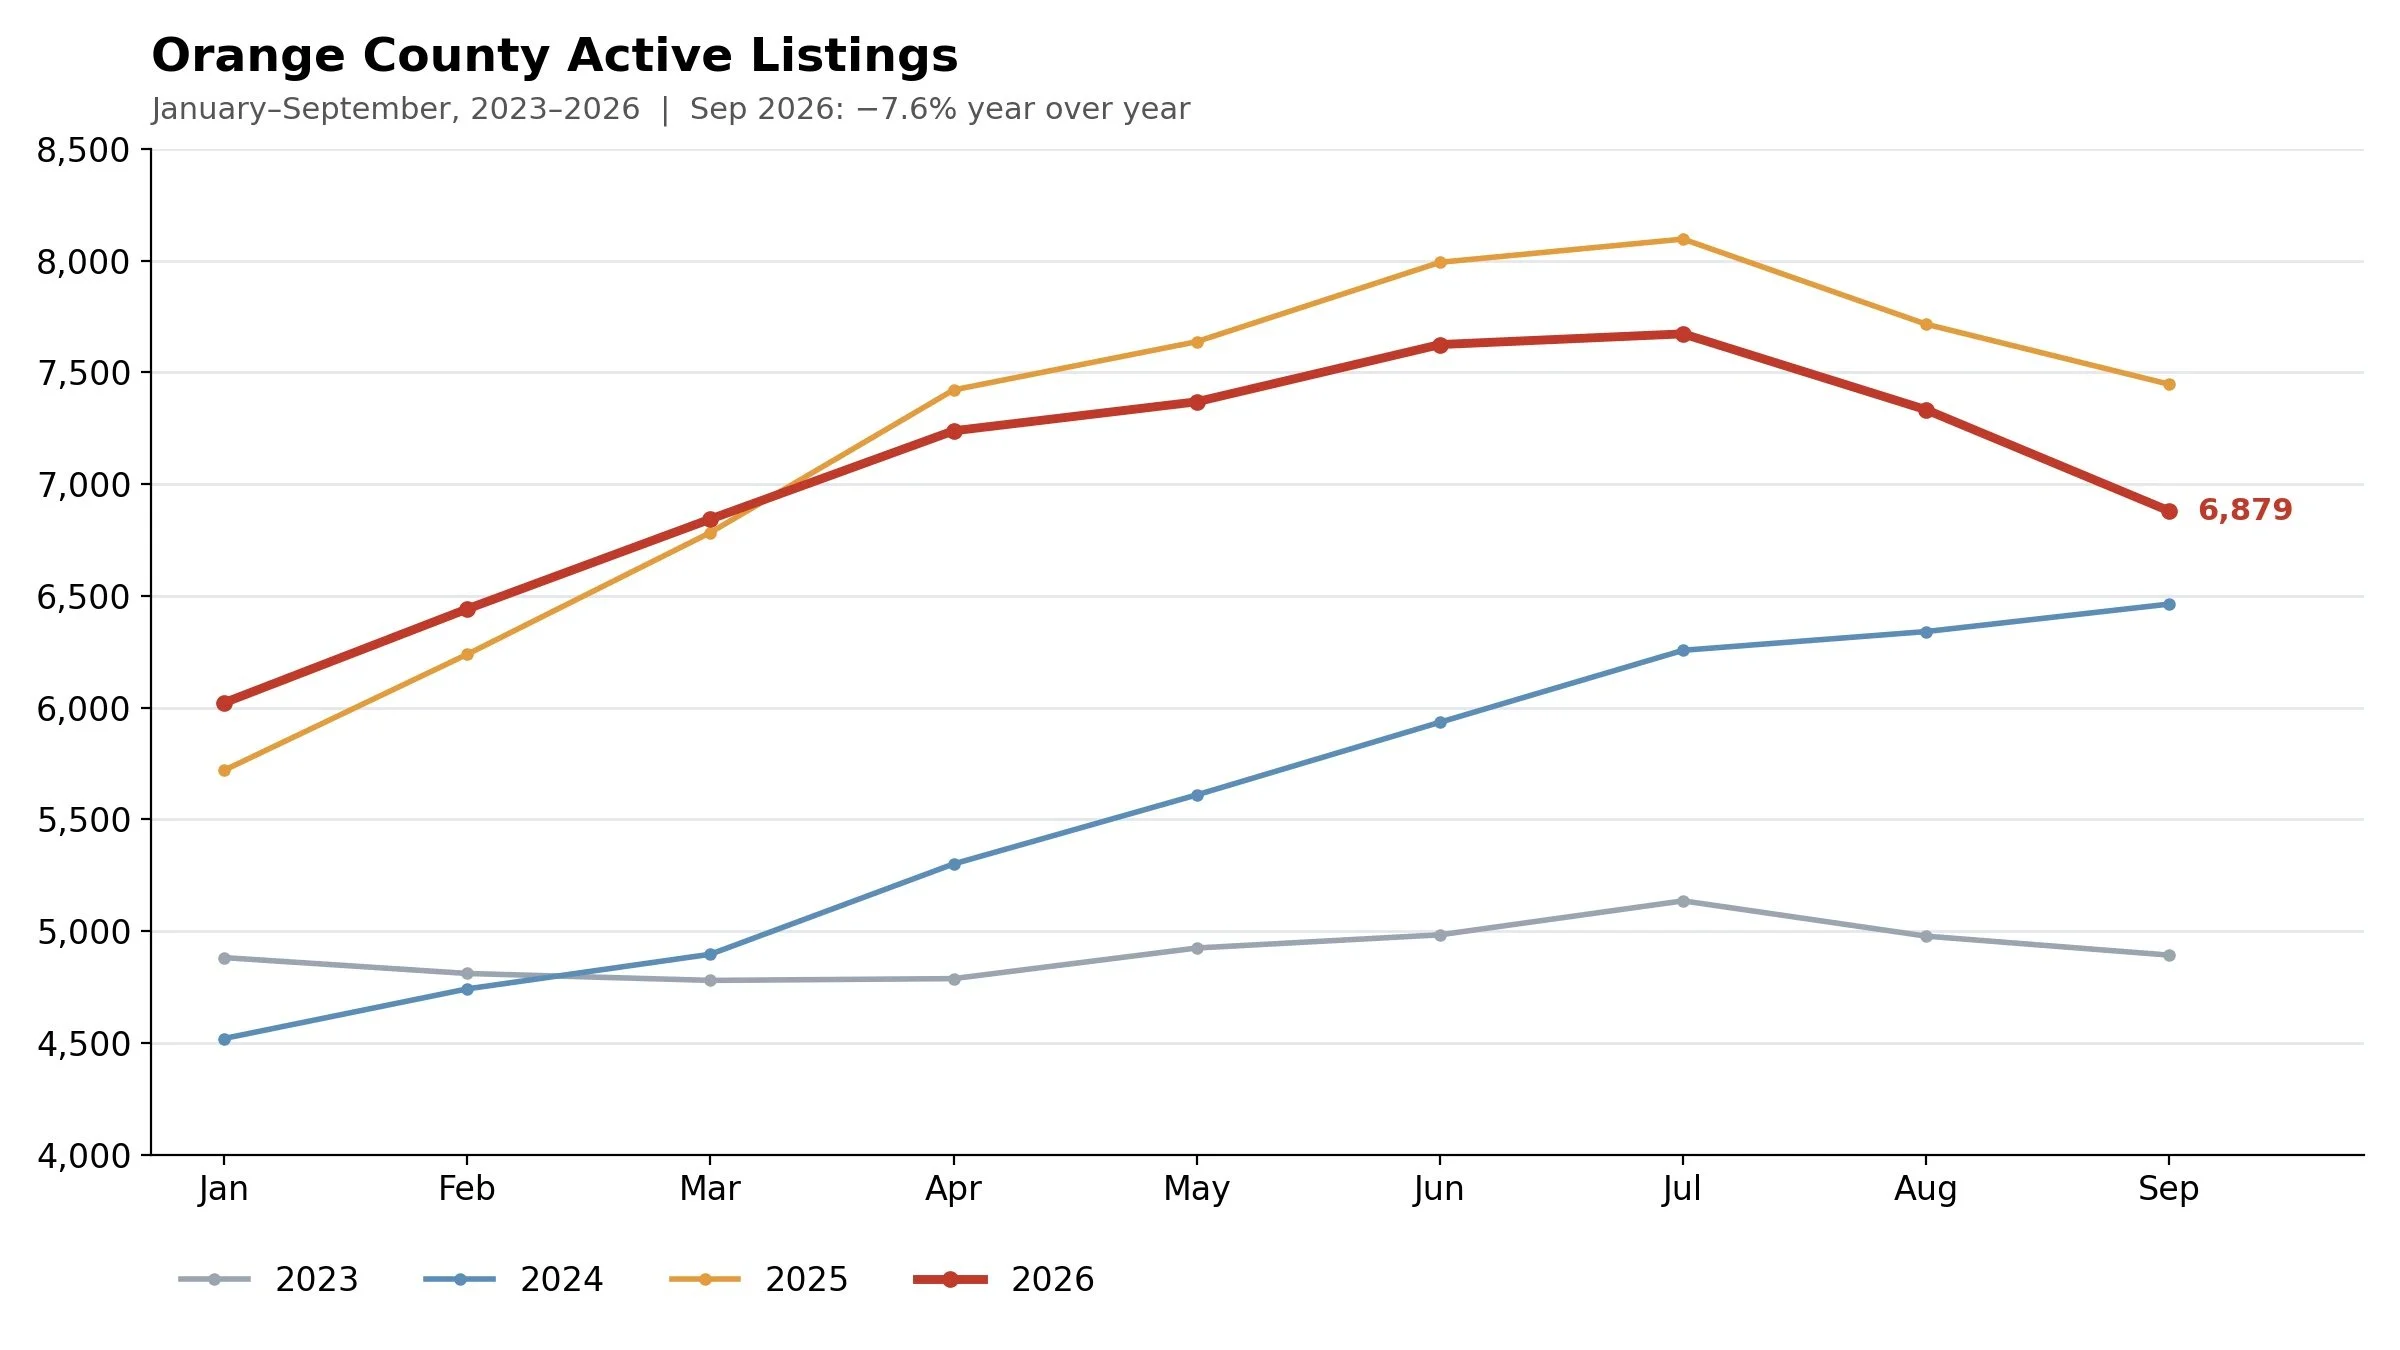
Orange County active listings increased substantially through 2024 and 2025, but inventory has contracted in 2026 from its summer peak.
Orange County Prices Are Holding Up Better Than the National Market
The national median sale price increased just 0.6% year over year in September 2026, according to Homes.com.
Orange County’s median sale price increased from $1,185,000 in September 2025 to $1,209,000 in September 2026, which is about a 2.0% increase.
That is not rapid appreciation, but it is still stronger than the national number.
And there is another important layer to the story: seasonality.
Orange County’s median sale price peaked at $1,257,000 in June 2026 and then declined to $1,209,000 in September 2026, a drop of about 3.8%. On the surface, some might look at that and conclude the market is weakening sharply.
But that same pattern has shown up in prior years:
2025: June to September median price decline of about 3.7%
2024: June to September median price decline of about 4.1%
2026: June to September median price decline of about 3.8%
In other words, this year’s decline looks very similar to the normal late-summer to early-fall seasonal slowdown.
That distinction is important. A decline in the median from summer to fall does not automatically mean the market is breaking down. In Orange County, that pattern has been fairly consistent.
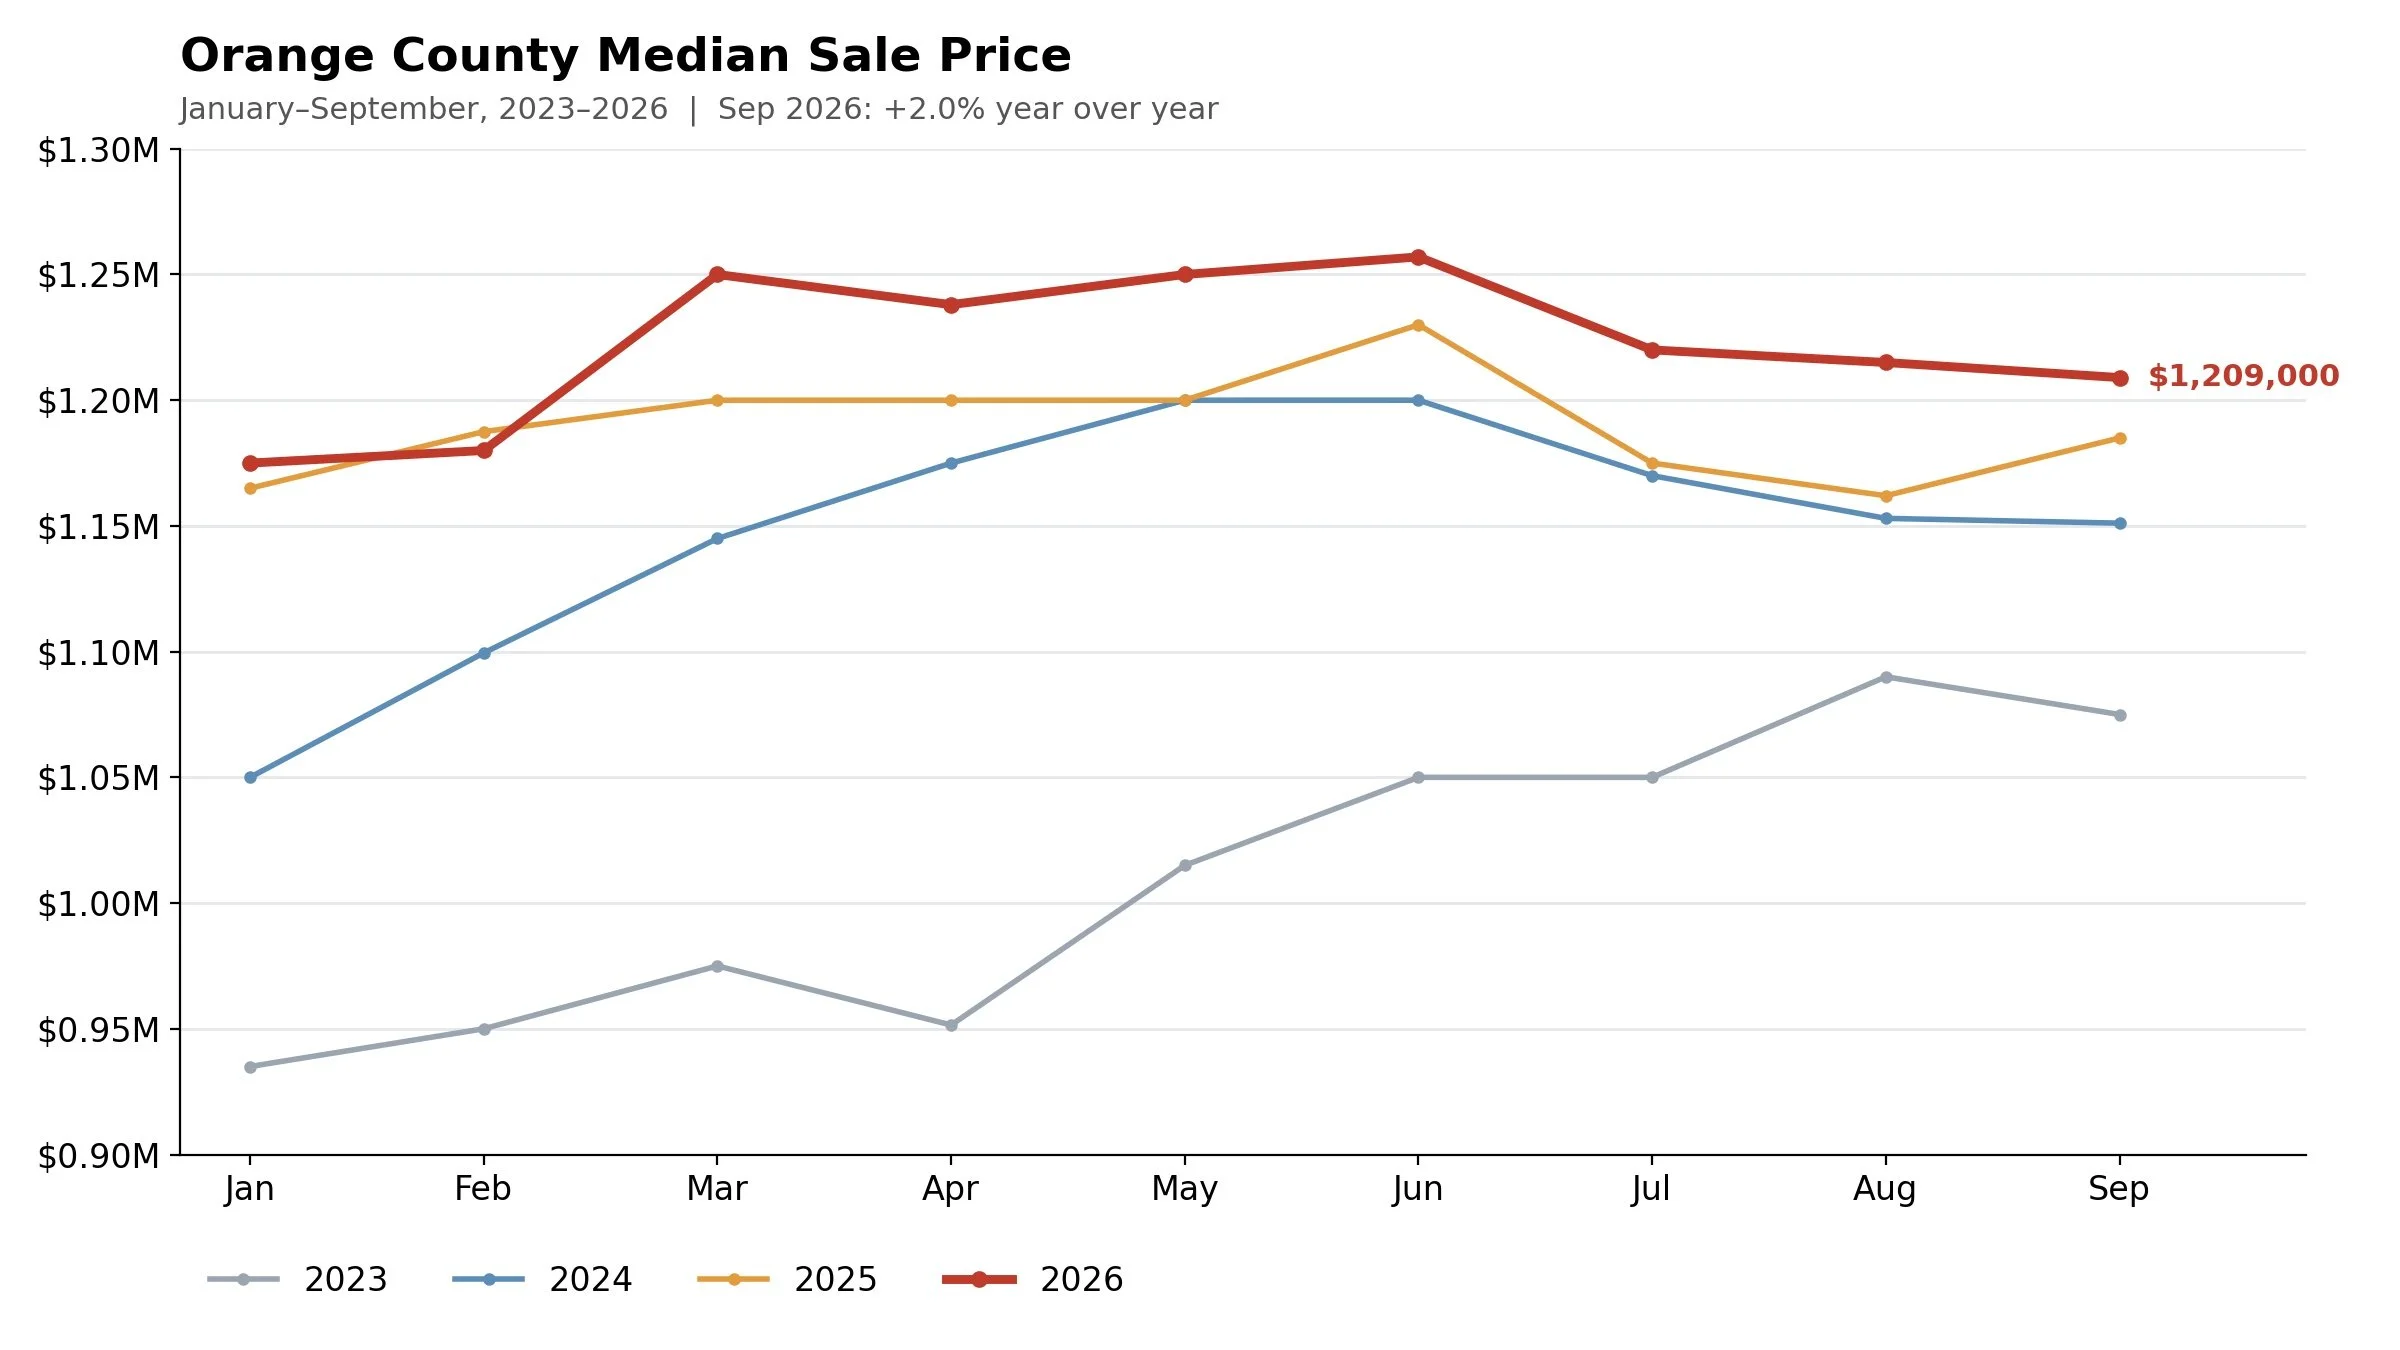
Orange County median sale prices typically peak in late spring or summer and soften into fall. The 2026 decline from June through September is closely in line with the same seasonal pattern seen in 2024 and 2025.
Sales Are Slower, but Not Collapsing
Orange County recorded 1,729 closed sales in September 2026, down from 1,812 in September 2025, a 4.6% decline.
That is certainly slower, but still slightly better than the 6.0% national decline reported by Homes.com.
Looking at the bigger picture, Orange County’s sales volume has actually been fairly stable for the year overall. Through the first nine months of 2026, Orange County recorded 15,546 closed sales, compared with 15,672 during the same period in 2025. That is a decline of only about 0.8% year to date.
New listings have also been relatively steady. Orange County recorded 2,270 new listings in September 2026, compared with 2,262 in September 2025, which is essentially unchanged.
That combination — relatively stable new supply and only modestly lower year-to-date sales — helps explain why inventory has actually tightened rather than expanded.
Buyers Have More Leverage Than a Few Years Ago
Although prices are holding up, that does not mean today’s market is as competitive as it was a few years ago.
Other market indicators show a more balanced environment:
Median days on market: 21 days in September 2026 vs. 22 days in September 2025
Months of inventory: 4 months in both September 2025 and September 2026
Average percent of original list price received: 97.1% in September 2026 vs. 96.9% in September 2025
Those numbers suggest that buyers still have some negotiating power. Sellers are no longer seeing the kind of aggressive pricing environment that was common during stronger market conditions.
And compared with earlier years, the shift is more noticeable. In September 2024, Orange County sellers were receiving about 98.7% of original list price on average. In September 2023, that figure was about 99.8%.
So while prices remain relatively stable, the market is not nearly as overheated as it once was.
That means pricing strategy matters more today. Homes that are well-prepared and realistically priced are still selling, but buyers are more selective and more willing to negotiate than they were during the peak frenzy.
The Best Visual Summary: U.S. vs. Orange County
The clearest way to see the difference is by comparing the September year-over-year changes side by side.
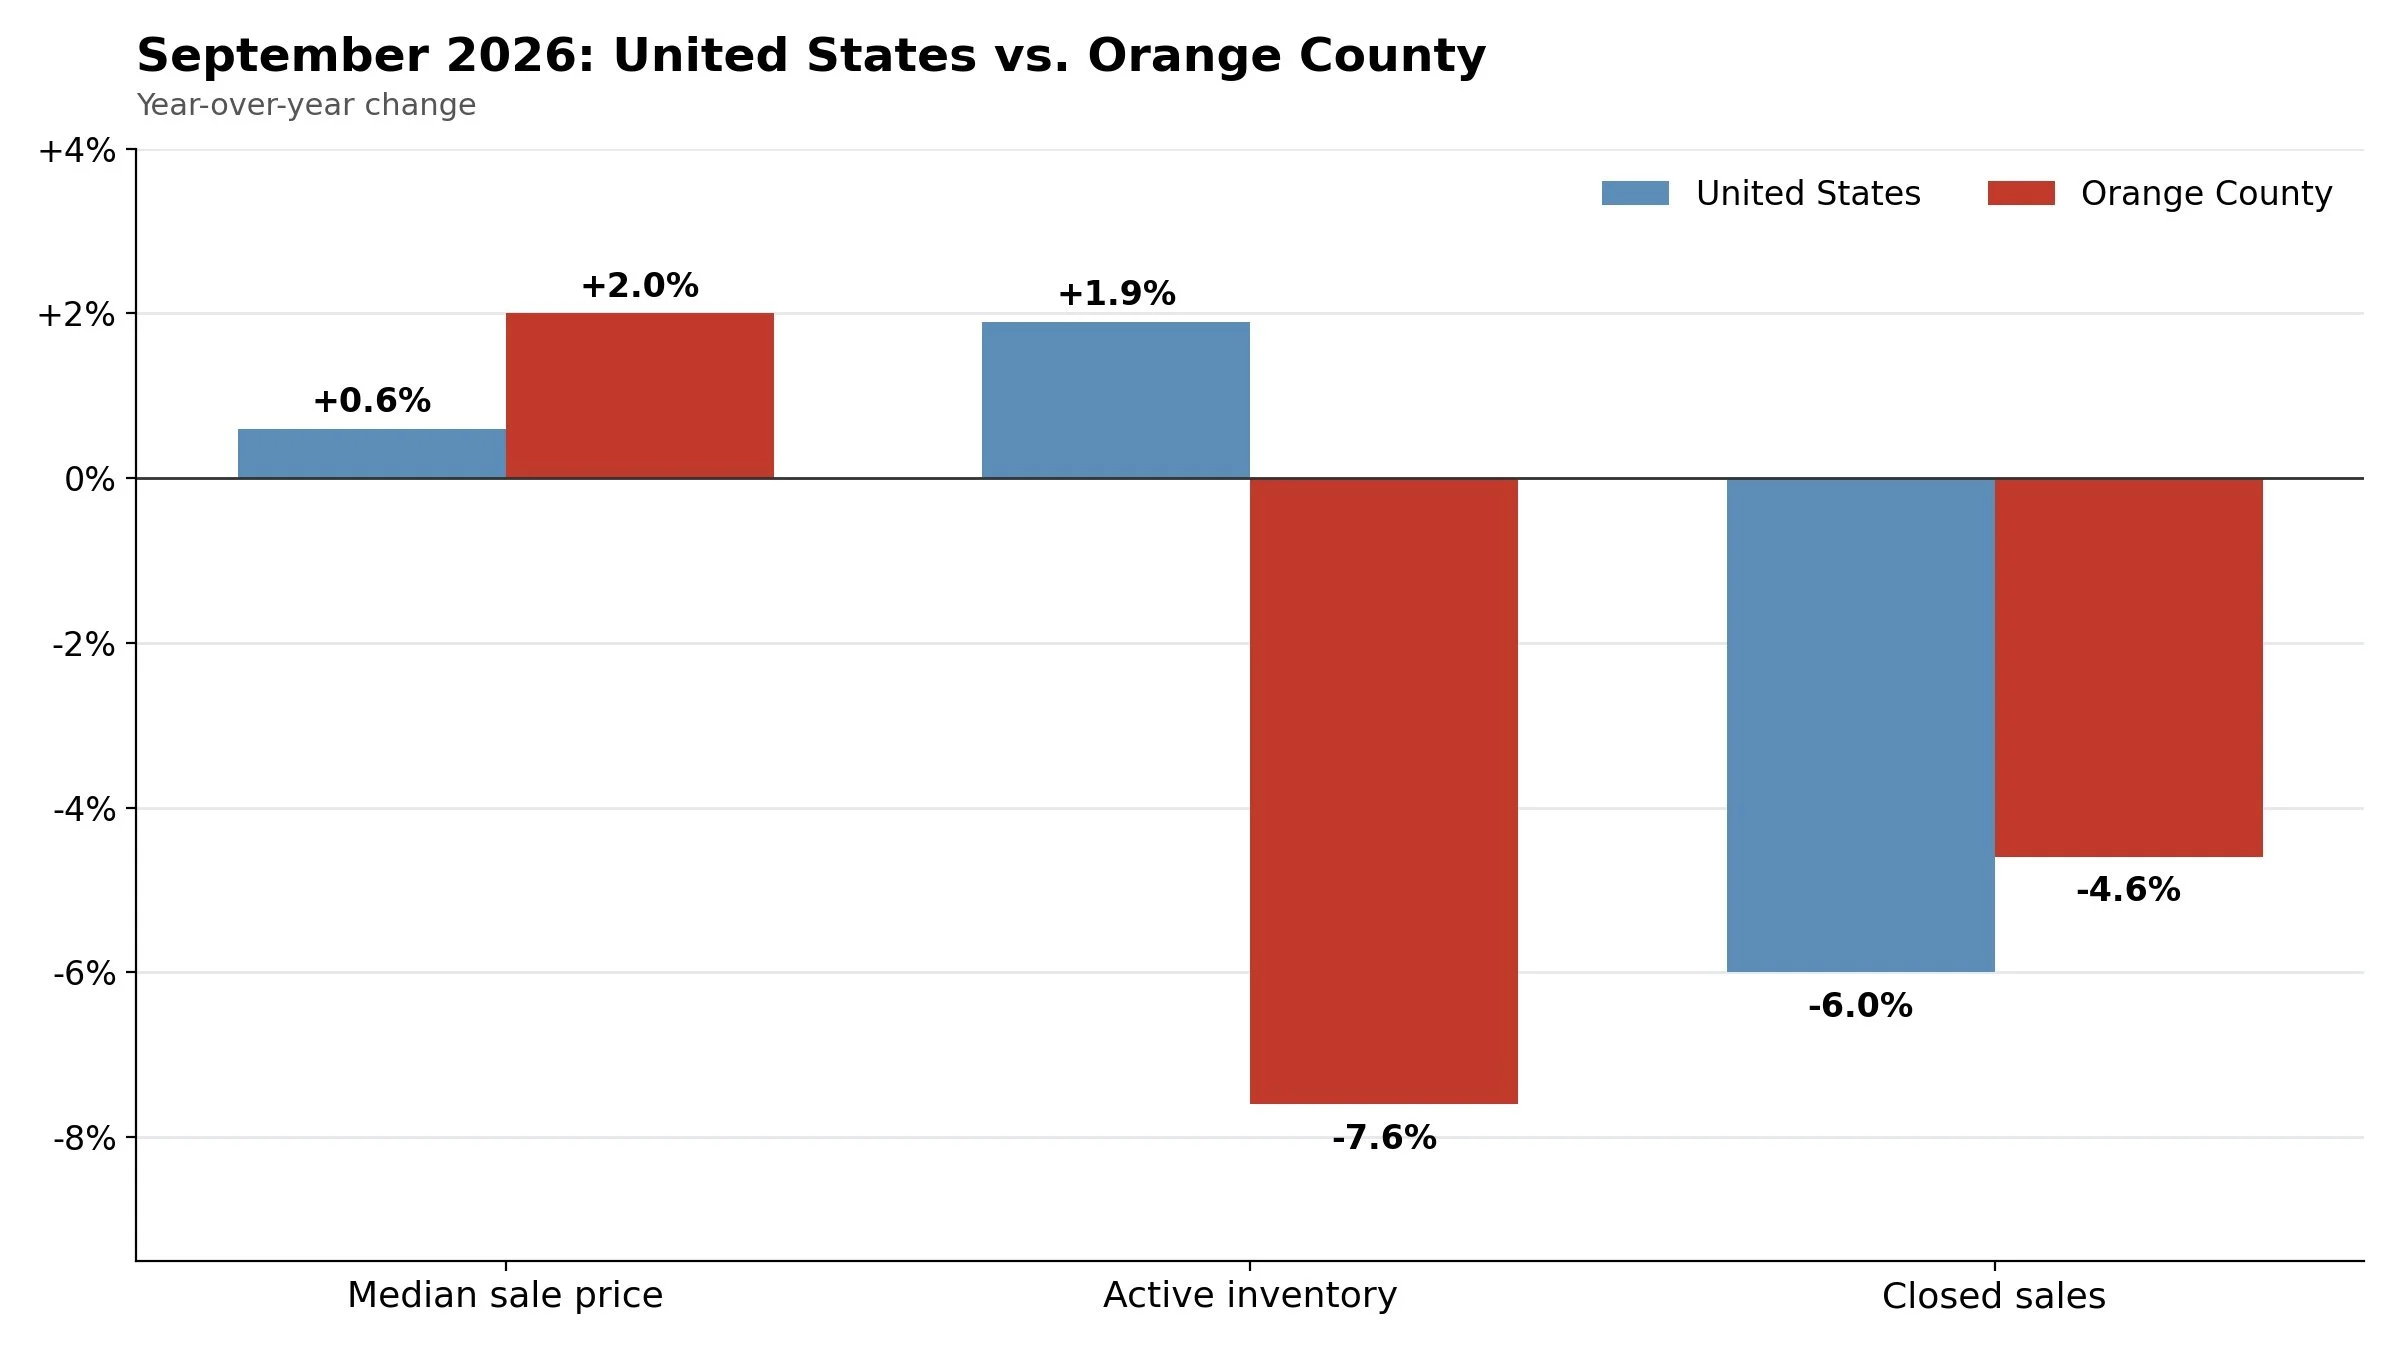
Orange County outperformed the national market on price growth, saw a sharper decline in inventory, and experienced a slightly smaller drop in closed sales.
The Bottom Line
The latest national housing data tells a useful story, but it does not tell the whole story for Orange County.
Nationally, the housing market is showing:
slower sales,
slightly higher inventory, and
nearly flat price growth.
Orange County, on the other hand, is showing:
lower inventory,
modest price growth, and
slower, but still relatively steady sales activity.
In short, Orange County is participating in the broader market slowdown, but not in exactly the same way.
The market has cooled from its hottest years. Buyers have more leverage. Homes are not flying off the shelf the way they once did. But the local data still points to a market with meaningful supply constraints and pricing support.
That is why local housing analysis matters. National headlines may frame the big picture, but if you want to understand what is really happening in Orange County, you have to look at Orange County itself.
Sources
National market data: Homes.com National Housing Market Report
Orange County market data: California Regional Multiple Listing Service (CRMLS) Stats
Average Percent of Original Price Received: InfoSparks by ShowingTime Plus, sourced from MLS data
Just Appraisals, Inc. provides independent, USPAP-compliant residential appraisals across Orange County. Market reports like this one show which way the county is moving. An appraisal shows where one home sits in that market as of a specific date, which is what matters when you're setting a list price, settling a trust or estate, establishing a date-of-death value, or need a number that holds up in a divorce. More about my background here.
Wondering what this market means for your home's value? Get in touch.