Orange County Price Per Square Foot Trends: A Four-Year Look at the Market
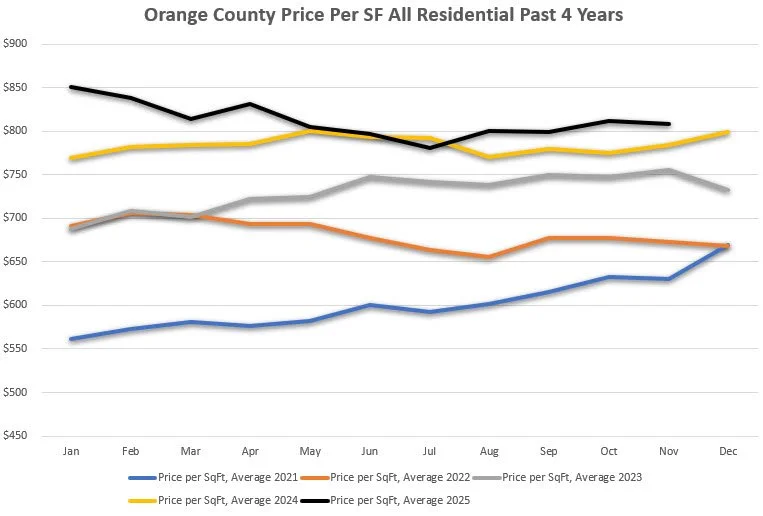
The chart above illustrates Orange County residential price per square foot trends over the past four years, providing a clear snapshot of how the market has evolved through shifting interest rates, inventory constraints, and changing buyer behavior. Each line represents a yearly average, with the black line reflecting the current year, 2025.
Big Picture Overview
When viewed together, the data tells a story of long-term resilience with short-term volatility. While individual years show seasonal ups and downs, the broader trend confirms that Orange County real estate pricing remains historically strong, even as the market adjusts to higher borrowing costs and affordability pressures.
2022: A Volatile Adjustment Year
The 2022 line reflects a period of transition. Prices began the year relatively strong but softened mid-year as mortgage rates rose rapidly. This created downward pressure on price per square foot, particularly during the summer months, as buyers recalibrated purchasing power and sellers adjusted expectations.
Despite this correction, pricing never collapsed. Instead, it reset to a level more consistent with fundamentals, reinforcing Orange County’s long-term desirability and supply limitations.
2023: Stabilization and Modest Recovery
In 2023, the market showed greater stability. Price per square foot trended upward through much of the year, suggesting buyers had acclimated to higher interest rates. Inventory remained tight, and well-located, well-conditioned homes continued to command strong pricing.
This year reflects a market that was no longer reacting, but instead re-establishing equilibrium.
2024: Gradual Appreciation with Seasonal Patterns
The 2024 data shows modest appreciation paired with familiar seasonal trends. Prices generally strengthened through the spring and early summer, softened slightly mid-year, and then firmed again toward year-end.
This pattern aligns with historical norms and indicates that Orange County real estate had moved back into a more predictable cycle, supported by limited housing supply and steady demand.
2025: Current Year Insights
The black line representing 2025 stands out for its consistency. Prices started the year at elevated levels relative to prior years and, while experiencing minor mid-year softening, have largely held firm.
This suggests several important market dynamics:
Sellers remain disciplined on pricing
Buyers are selective but active
Desirable properties continue to attract competition
Supply constraints are preventing meaningful downward pressure
Rather than sharp appreciation or decline, 2025 reflects a balanced but tight market, where values are being supported by fundamentals rather than speculation.
Key Takeaways
Long-term upward trend: Despite short-term fluctuations, price per square foot remains well above pre-2022 levels
Seasonality still matters: Most years show spring and early summer strength with softer late-summer pricing
Inventory is a major driver: Limited housing supply continues to underpin values
Market maturity: Recent years show fewer extreme swings and more rational pricing behavior
Why Price Per Square Foot Matters
Price per square foot is a useful high-level indicator, particularly when analyzing trends over time. While it should never replace a detailed comparable sales analysis for valuation purposes, it does provide insight into:
Market direction
Buyer sentiment
Relative affordability
Momentum or deceleration
For homeowners, buyers, investors, and estate planning professionals, understanding these trends helps set realistic expectations and informs better decision-making.
Final Thoughts
Orange County’s real estate market continues to demonstrate resilience. While the rapid appreciation seen in prior cycles has moderated, pricing remains historically strong, supported by location, demand, and long-standing supply constraints. The 2025 data suggests a market that is stable, disciplined, and fundamentally sound.
As always, individual property characteristics, location, condition, and use significantly impact value, and broader market trends should be viewed as context rather than a substitute for property-specific analysis.
Disclaimer:
All data referenced herein was obtained from CRMLS and is deemed reliable but not guaranteed. This information is provided for general market insight only and should not be relied upon as a substitute for a professional appraisal or market analysis.